

Interview: David Cross and Jay Agrawal on Copperleaf’s New Interactive GIS Experience

Understanding the geospatial impact of investments has become easier and more efficient with the introduction of the Interactive GIS Experience for Copperleaf Portfolio™ and Copperleaf Asset™. David Cross, Geospatial Enablement Team Lead, and Jay Agrawal, Product Manager, Guided Investment & Geospatial, discuss the value of this new option for Copperleaf® clients.
What client needs are front-of-mind when developing GIS features?
“Many Copperleaf clients already have valuable data in their Geographic Information Systems (GIS). This data can range from operational information like asset locations to population levels of the neighborhoods they service. This information is essential for creating capital plans that meet our clients’ business objectives.
Currently, many of our clients perform workarounds to incorporate GIS data in their capital planning. These workarounds can be time-consuming and cumbersome. Many of our customers have also made significant investments in GIS infrastructure, people, and processes. Copperleaf’s geospatial integration capabilities are designed to make the most valuable use of these investments by making GIS data directly available to users within Copperleaf.”
What standard GIS features are part of Copperleaf Portfolio and Copperleaf Asset?
“With the standard GIS features included with Copperleaf Asset, our clients can see the locations of their asset population in embedded maps in the Copperleaf UI. For example, when investigating an overhead line segment or a culvert, you can quickly review the asset attribute data and the asset’s location at the same time in Copperleaf. Similarly, in Copperleaf Portfolio, when reviewing a road repair investment, you can also see the locations of all road segments being repaired by this investment on an embedded map in the Copperleaf UI.
Our clients can bring geospatial information into the decision-making context by adding layers to the map. Data layers may include a wide variety of reference information such as population demographics, waterways and flood risk, wildfire risk and other natural hazards, location of critical infrastructure, terrain, and access issues that may affect costs.”
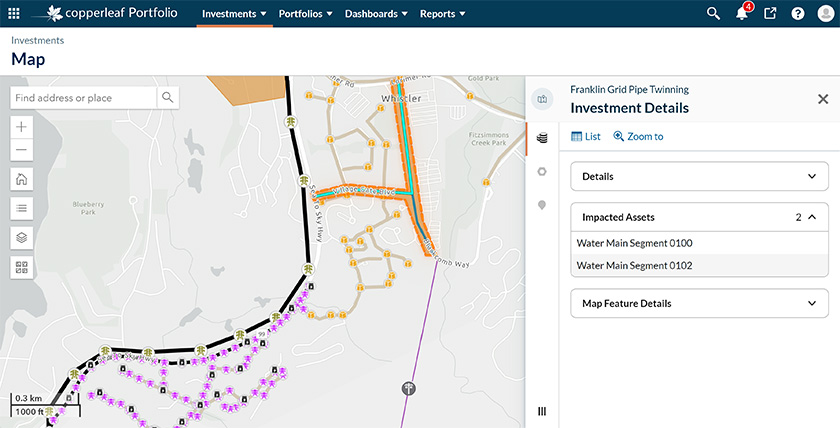
Map view of assets affected by an investment in Copperleaf Portfolio
Compared to the standard GIS features in Copperleaf, what additional value does the Interactive GIS Experience bring?
“The standard GIS features described above are great at visually surfacing the geospatial context to clients. The Interactive GIS Experience builds on that functionality by integrating Copperleaf and GIS in all aspects of the asset investment planning process.
For example, with map-based asset selection in Copperleaf Portfolio, you can use GIS information to define the scope of your investments. Imagine you notice a transformer is degrading, so you would like to create an investment to replace this transformer and address the safety risk. Using the Interactive GIS Experience, you can easily find the transformer on an embedded map in Copperleaf. Then, you can interact with the map to add the transformer to the investment. You can also look at reference information such as nearby investments, electricity load, population levels, and other available GIS data to inform your decision. To minimize outages, you can also view nearby circuit breakers that you may want to include in the investment.
Another capability of the Interactive GIS Experience is using map-based visualizations to understand and compare asset sustainment plans. Our clients use Predictive Analytics to determine the ideal asset sustainment strategy that ensures their asset base can support their organization’s goals over the short and long term. Combining Predictive Analytics with the Interactive GIS Experience lets you create various asset strategy alternatives to carry out what-if analysis.
For example, you can create one scenario that optimizes your plan within budget constraints, and another scenario that considers a 10% budget increase. These sophisticated scenarios are exactly where visualizations can help. Using a map to see the results of various strategy alternatives, you can quickly assess the outcome of your different scenarios. You can then use a time slider to see the various risk levels, benefits, costs, and intervention dates over time.”
How can GIS help organizations understand the impact of potential investments on ESG (Environmental, Social, and Governance) objectives?
“Certain ESG objectives can be effectively measured and communicated through GIS data. By surfacing this data in Copperleaf, clients can quickly assess the impact of their capital plans on these objectives.
For example, some regulators require a specific portion of investment budget to be allocated to the betterment of disproportionately burdened communities. Copperleaf’s Value Framework allows our clients to incorporate these parameters in their optimization to produce a plan that meets environmental social justice objectives.
To communicate this impact effectively, clients could use Copperleaf’s new GIS features to overlay their plan alongside census data to show the dispersion of asset investment spend across different neighborhoods, as well as the resulting impact of the investments.”
How can clients take advantage of Copperleaf’s GIS features?
“To enable these features, we use our clients’ existing GIS data. Currently, Copperleaf can integrate with Esri’s ArcGIS platform, either Online or Enterprise.”
To learn more about Copperleaf’s GIS capabilities, download the brochure or contact us.